On the Fourth of July, President Trump signed the Republican reconciliation bill into law. A couple weeks ago, I wrote about the devastating impacts that this bill would have on SNAP. Other publications have extensively covered the overall effects of the bill, namely, harming low-income people and helping rich people.
Today, I wanted to dive a little deeper into the Medicaid aspects of the bill. There are many components to the Medicaid cuts, but I wanted to highlight three major ones. First, the work requirement: people ages 19-64 who do not have a dependent child under 14 and who are not disabled will need to work (or participate in other qualifying activities) at least 80 hours per month or they will not be eligible for Medicaid. Second, the bill cuts down on so-called “provider taxes,” which are taxes levied by states on medical facilities to finance the non-federal portion of Medicaid. Lastly, the bill reduces the share of the cost of Medicaid expansion taken on by the federal government.
As of this writing, there is no CBO projection for the reduction in Medicaid enrollment under the final version of the bill, but CBO did estimate that the House version would reduce enrollment by over 10 million in 2034 relative to what it would have been. Since the final version of the bill cuts more money from Medicaid than the House version, it stands to reason that the Senate version would reduce Medicaid enrollment by even more.
With all that as preamble, I wanted to show the widespread impact that these cuts will have, so I put together a map showing the share of people on Medicaid in each county, using data from the 2019-2023 American Community Survey.
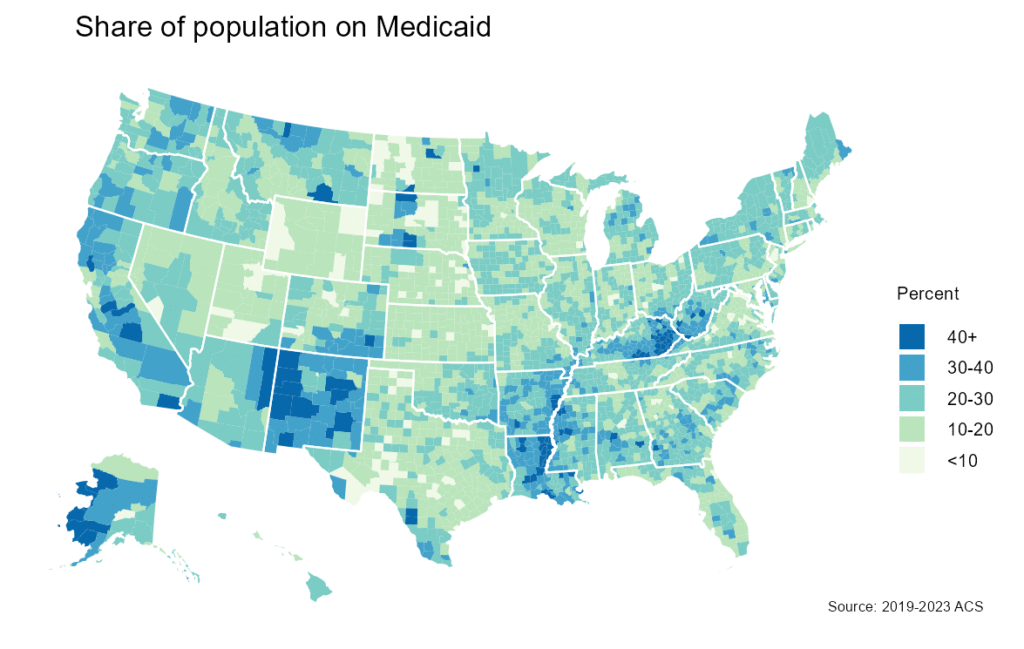
This map shows that in the vast majority of counties in the country, at least 10% of the population receives Medicaid. In fact, the share of population getting Medicaid in under 10% in only 137 out of 3,142 counties. At least 20% of people are on Medicaid in over half the counties. Overall, just under 70 million people reported receiving Medicaid, about 1/5th of the country.
Eagle-eyed readers will notice that the patterns in this map are quite similar to the map from my SNAP post. To illustrate how the this further, I graphed the relationship between the share of a county that gets Medicaid and the share of a county living in a SNAP-receiving household.
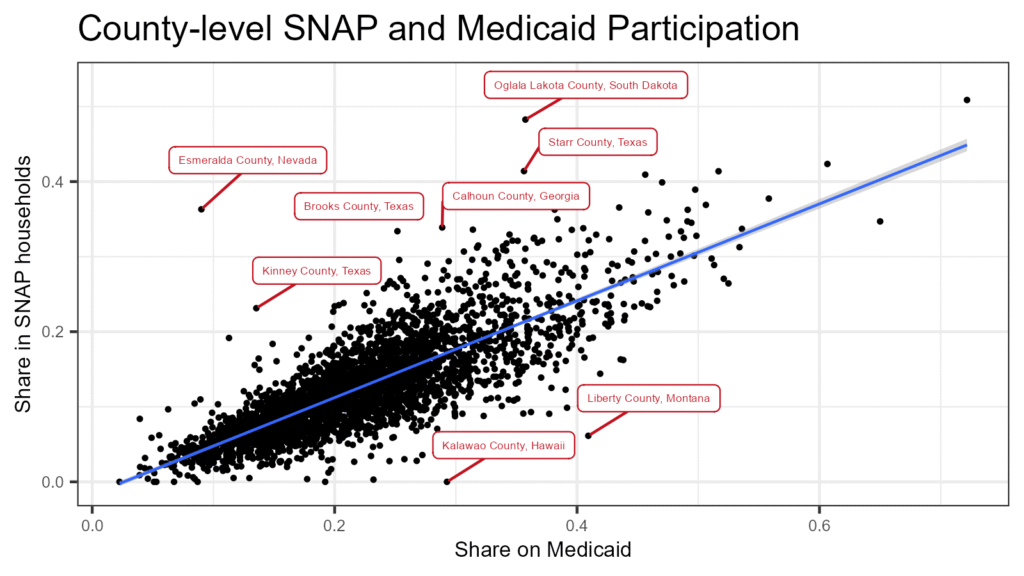
I labeled the outliers for the curious, although most of these are quite small counties so I wouldn’t read too much into those. As you can see, there is a very strong relationship between Medicaid and SNAP receipt. What this shows is that the poorest counties, those where people are already facing the most material deprivation, will be decimated by the combined impacts of both the SNAP and Medicaid cuts.
In addition to looking at the total Medicaid population, I also wanted to look at the number of people in different areas who are getting Medicaid and are subject to but not currently meeting the work requirement. These are the people who we know are at the highest risk of losing Medicaid when the work requirement goes into effect. My initial instinct was to do this by county, but the Census Bureau does not release county identifiers in the public-use microdata for the ACS. (The data for the map comes from pre-tabulated tables on the Census website.) Instead, I tabulated the data for metropolitan areas that are identified by IPUMS. The table below shows the 15 most populous metropolitan areas, sorted by the number of Medicaid recipients who are subject to but are not currently meeting the work requirement.
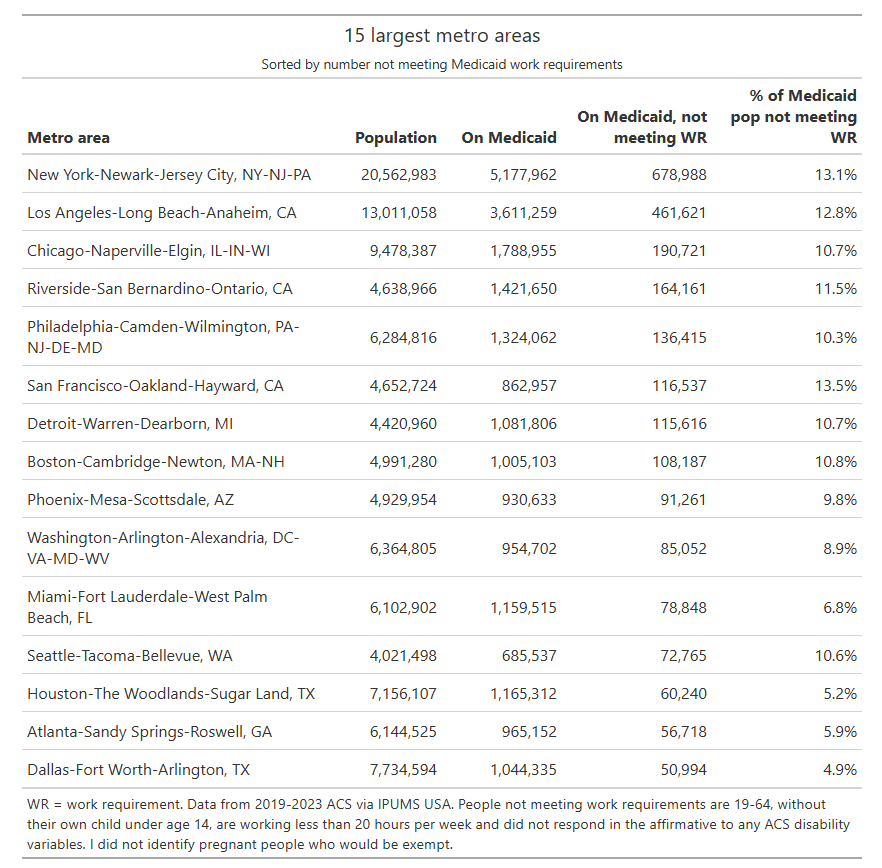
Almost 700,000 people in the New York City area are subject to the Medicaid work requirement and are not currently meeting it, representing over 13% of the Medicaid population in the area. In Los Angeles, nearly half-a-million people are at risk of losing their Medicaid. Across the country, I estimate that about 6.6 million people in total are on Medicaid, are subject to the work requirement, and are not meeting it. There are many reasons why someone might not meet the Medicaid work requirement: they are caring for a family member other than a young child, they don’t have transportation to get to a job, they have a job but don’t get assigned enough hours, they have a disability that limits their ability to work but does not meet the definition for an exemption, and so on. Not meeting the work requirement does not mean that someone is just lazing about. However, even if someone is just lazing about, they still deserve healthcare. The choice should not be between work and risking death.
An additional aspect to this is that many people who do meet the work requirement will nonetheless lose their Medicaid because they fail to fill out the paperwork correctly. And then we have to circle back to the two other major cuts I mentioned at the top: the cap on provider taxes and the reduction in federal funding. These may force states to add their own restrictions to Medicaid enrollment, forcing even more people off the rolls. Millions of people’s lives are going to be made much, much harder to help fund tax cuts for the wealthy.
0 Comments