The Zohran Mamdani free bus proposal has been living fare-free in my brain for quite a while now. There’s a vibrant debate among transportation experts and urbanists as to how making transit free compares with other transit improvements in terms of increasing ridership, decreasing car dependency, and other outcomes. While thinking about all this, it occurred to me that Alexandria, Virginia made buses free in 2021. I live right next to Alexandria in Arlington, so I decided to compare bus ridership in Alexandria and Arlington to get an insight into the effects of making the bus free. This is what economists call a natural experiment.
First, I need to mention a major caveat. In order to truly understand the effects of free buses, making the bus free would need to be the only change that Alexandria made to its bus system in 2021. Unfortunately for this experiment, Alexandria also redesigned all of its bus routes at the same time it removed fares. Thus, I won’t be able to say whether the changes in ridership are due to removing fares or due to the route reorganization, but rather the combined effect of these policy changes. However, I think looking at this question can still provide us with interesting results that can be informative in the context of New York. Plus, I started analyzing the data before I realized this. What’s the sunk cost fallacy?
Another warning: this is going to get wonky.
Bus Ridership
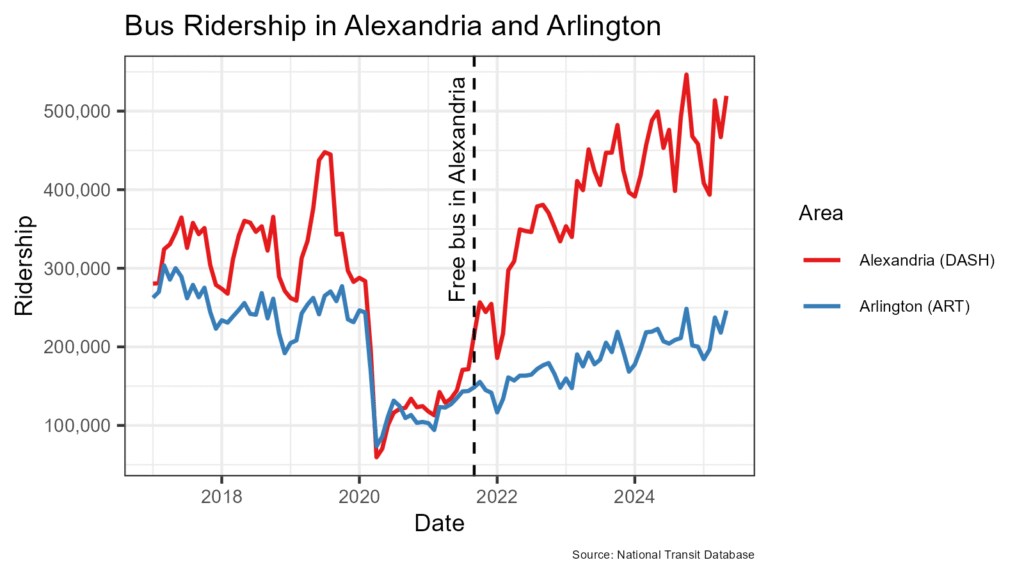
The graph below shows bus ridership on the bus systems in Alexandria (DASH) and Arlington (ART) since 2017. It does not include ridership on other systems that operate in these areas, such as WMATA’s MetroBus. Bus ridership in Alexandria was consistently higher than in Arlington until the pandemic, when ridership in both plummeted to roughly equal levels. Then, beginning around the time Alexandria made buses free and reorganized their bus routes, ridership in Alexandria began to increase much more rapidly than in Arlington.

By 2025, monthly bus ridership in Alexandria was almost ten times the pandemic nadir, while in Arlington ridership was only about four times greater than the pandemic low. It’s pretty clear that Alexandria’s policies contributed to a strong increase in overall ridership.
Commuting by Bus
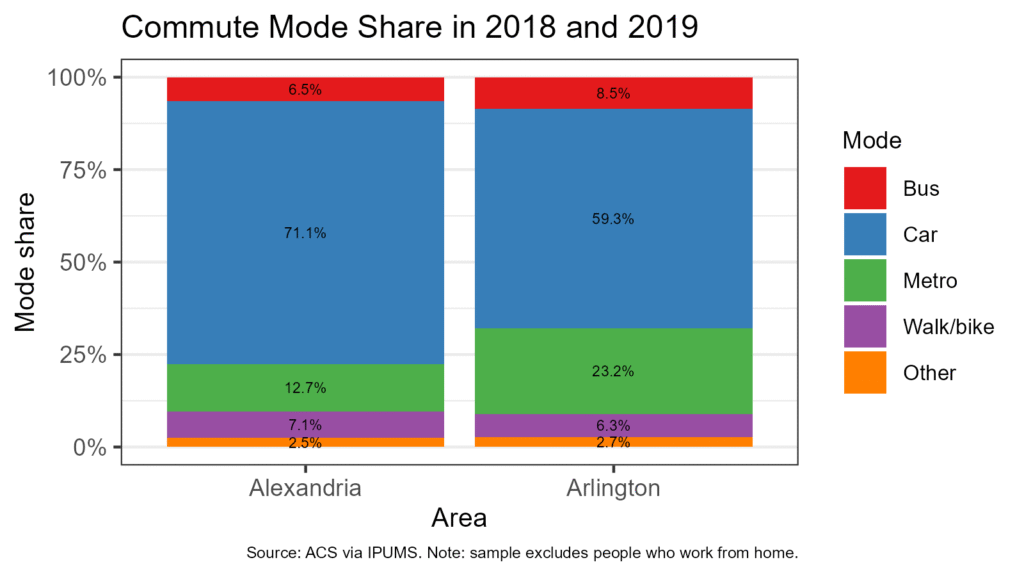
I also wanted to see how the changes in Alexandria affected commute mode share—that is, the primary method of transportation used to get to work. To do this, I used data from four years of the American Community Survey: 2018, 2019, 2022, and 2023. I pooled the four years of data and then grouped together the two years before the buses were made free and the two years after. First, the graph below shows how people were getting to work in 2018 and 2019, before the bus system changes in Alexandria.

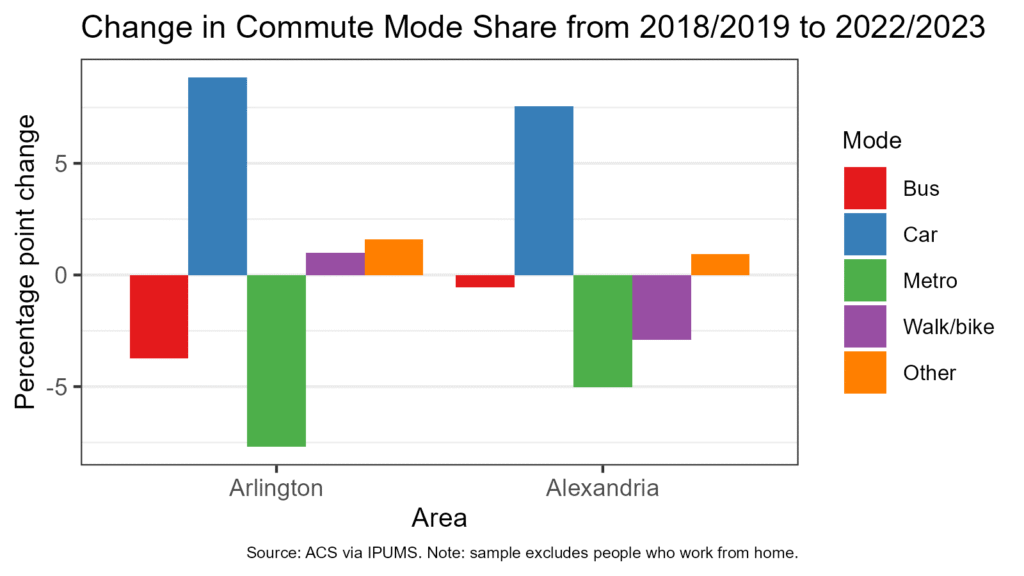
Next, to look at the difference in commute mode share, I subtracted the percentage of each commute type before the bus changes from the percentages after the changes.

We can see that the share of people using the bus to commute to work fell in both Alexandria and Arlington. However, the decline was much bigger in Arlington (about 3.7 percentage points) than Alexandria (about 0.5 percentage points). If we assume that the trends in commute mode share would have been the same in Arlington and Alexandria were it not for the bus changes, then we can attribute any difference that does exist to the bus changes. This kind of analysis is known as difference-in-differences. Thus, the relative change, the difference in the difference, is an increase in bus ridership of 3.2 percentage points in Alexandria.
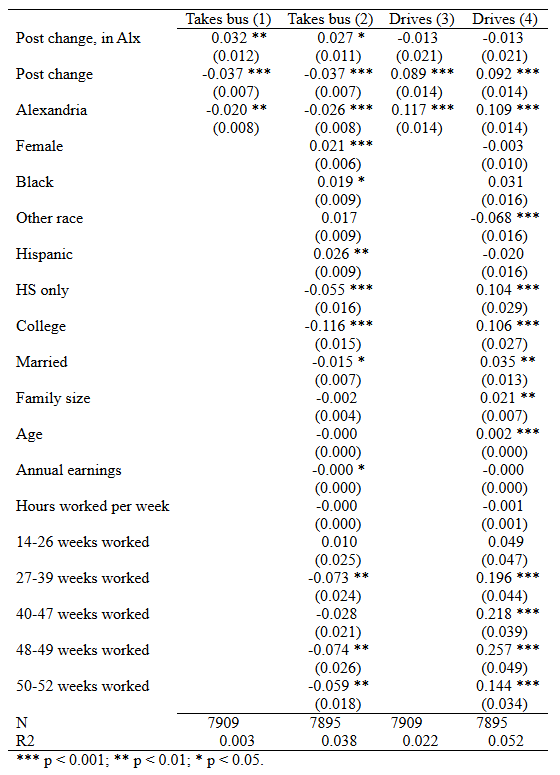
I can hear you saying, “Kevin, what about significance? Is this difference really statistically significant?” And reader, thank you for asking. To test the significance, I ran a regression on the sample of people who commute to work. (Regression results are at the end of the post.) I made the dependent variable a binary indicator of taking the bus to work and used three independent variables: a binary variable for living in Alexandria, a binary variable for being in the data after the bus changes, and an indicator for both living in Alexandria and being surveyed after the bus changes. The coefficient on this last variable is our number of interest. For a more detailed explanation on difference-in-difference regressions, take a look at this explainer. The resulting regression indicates that the bus changes resulted in a 3.2 percentage point increase in bus commuting in Alexandria, a result that is statistically significant at the 1% level. This confirms our finding from earlier.
I also ran the regression again, this time with a bunch more independent variables such as race, education, sex, age, earnings, and so on. Adding these variables controls for changes that may otherwise influence the share of people commuting by bus. As an example, say that between 2019 and 2022 Alexandria saw a relative increase in the number of low-income workers. This could cause bus ridership to increase and be unrelated to the changes to the bus system. Adding earnings as an independent variable removes this potential issue. Once I control for these other factors, the effect of the bus changes drops slightly, to 2.7 percentage points. The result is significant at the 5% level.
Given that the share of people taking the bus to work in Alexandria was only about 6.5% before the changes to the bus system, an increase of 2.7 percentage points (relative to the not changing the bus system) constitutes an increase in bus commuting of over 40%.
Commuting by Car
Decreasing car dependency is an important goal of improving transit, so another important outcome we can look at is share of people who drive to work. Both areas also saw a large increase in the share of people who drive to work, but the increase was larger in Arlington (8.9 percentage points) than in Alexandria (7.6 percentage points). Again applying the difference-in-difference methodology, we can posit that the bus changes in Alexandria caused a relative reduction in the share of people who drove to work of about 1.3 percentage points.
I tested the significance of this result using the same regression methodology as above. This time, while the coefficient is once again in line with expectations (a decline in driving of 1.3 percentage points) it is not statistically significant. Adding control variables makes no discernible difference.
Conclusion
In the end, what conclusions can we draw? We can say that the changes Alexandria made to its bus system, which included making buses free, likely increased bus ridership relative to the counterfactual. We can also say that the changes likely increased the share of people who use the bus to commute to work. It’s possible that a small number of people shifted from driving to work to taking the bus, but we can’t say that with any confidence. It is much more likely that people who used to walk or bike to work now take the bus.
Given the huge increase in bus total bus ridership but the relatively small increase in bus commuting, we can also conclude that non-commute trips make up a large share of the new bus trips in Alexandria. It’s possible that this has displaced some driving, but we don’t have the data to say if that is true one way or another.
Although I’m somewhat disappointed that we didn’t discover a huge decrease in driving, if the changes to the bus system help more people get to where they want to go more efficiently than before, it’s still a good thing in my book. Again, getting rid of fares was only one part of the change, so we can’t extrapolate directly from what happened in Alexandria and say the outcomes in New York would be the same. This is an argument for improving bus routes and bus travel times in addition to making them free. In the end, making commuting to work, running errands, and visiting friends and family easier and more affordable is an admirable goal. Alexandria offers valuable lessons in how it can be achieved.
Regression Results

0 Comments